Polar Table Instructions
Polar Table Instructions
Boat Target Speeds
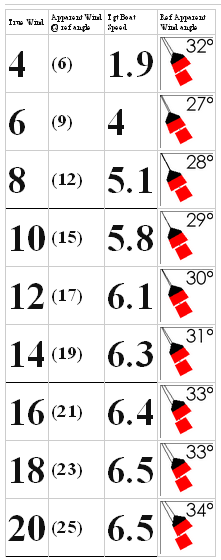 |
The table of targets to the left was created with this page. This is the first step of this two step page. The chart is created with a mathematical model of boat target speeds and polars based on the observation of a variety of polar data. What was learned from the data was that there are some things many different boats have in common, and some things that they don't. This led to the observation that you can generate a table such as the one at the left knowing the low wind target boat speed, and a high wind target boat speed. Once you have these using the other tools in this series, you enter those numbers on this page and generate this table. If you do not know your target boat speeds, there is information on the page to allow you to come up with a first guess. That will allow you to generate the larget table below, take it on the water, and refine your numbers. You can, of course, use the plotting tool and measure the boat speed vs wind angle and find the optimum boat speed directly. Either way, you can get started. Let me just explain the table to the left. The important columns are the first and third. That is why they use a large font. Using this table, once you know your true wind speed, you can look up your target boat speed. The second and fourth column are there to help you find the true wind speed. The idea is to sail close to the wind at the reference angle to the true wind (default is 45 degrees). At this heading, if you measure the apparent wind speed from the second column, the true wind speed will be in the first column. This is exactly correct if the boat is going the target speed at the time and is sailing at the reference apparent wind angle. The other ways to determine the true wind speed are covered in section 3 of the main polars page. |
VMG Table
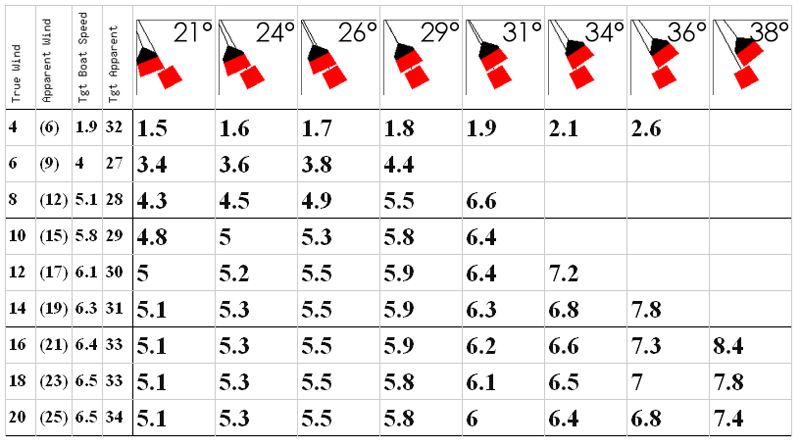
You will notice that the first 4 columns on the VMG table are almost identical to the first four columns of hte boat speed target table. The only difference, beside font size, is that the reference apparent wind is a number instead of a picture. These are your assumed targets. The rest of the table deserves some explination.
Every number under the apparent wind indicator picture is a boat speed. Every boat speed in a row represents a constant VMG for the given apparent wind angle indicated by that column. If your targets are perfect, you will only be able to sail at the boat speed corresponding to one of these headings. You would be going slower than the listed number for any other heading because only that one heading gives you the fastest VMG. That is why it is the target boat speed afterall. But if you are going slower than your target boat speed because you have the wrong sail, there is too much chop, or you are dragging a line behind, you won't be able to hit any of these numbers. The idea then is to sail at a heading that gets you as close to one of the numbers as possible. Similarlly, if you are fast that day, or your targets are not correct and you are able to exceed the numbers in that row, sail at the heading that gives you the greatest excess speed over the speed listed in the table. This is not exact, but the closer that the table is to your boats target speed, the less the error is.
What you are looking for is two or three entries that meet one of the following criteris. 1) Two entries are the best relative to the numbers in the chart and about the same amount better than the chart. In this case, use a target boat speed that is between the two boat speeds. 2) One entry that is the best and one on either side that is about the same worse as the one on the other side. In that case, use the best one.
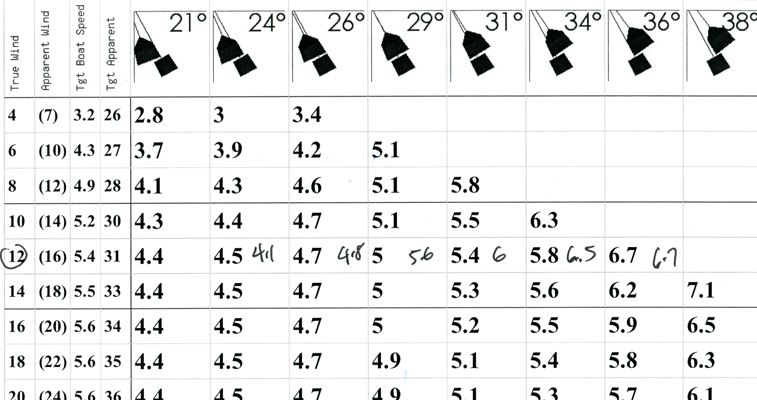
Running an example using simulated results for a Cal-40 the target boat speed was 5.9 knots for a VMG of 4.17 kt. Using the table, the 29 and 31 columns gave the same result with boat speed equal to the table entry. That would indicate by rule 1 to use 5.8 kt. This is close and would produce a VMG shortfall of 1/2 second per mile which is within our margin of error (the resolution of handicaps is 3 seconds per mile). The table below has a 1/2 knot error in the setup and yet stil indicates that 6 kt is the best speed. In the table below, the entries for 29, 31, and 34 are all about the same amount above the listed number and the 36 amd 26 entries are about the same amount slower than the listed numbers. This indicates that the 6kt entry (31) is the center or best number to use. This is a variation of rule 1 above.
Even this small error can be corrected for. This error is caused because of the difference between radial and rectangular distances. If you have a large error like in the example below, only move 80% of the way from the listed value to the new calculated value. For example, if the table shows a target boat speed of 6.5 knots but the closest you can get to one of the listed numbers is at a boat speed of 5.9 knots, don't change your target all the way to 5.9, use 6.0 knots.
NOTICE: Some pages have affiliate links to Amazon. As an Amazon Associate, I earn from qualifying purchases. Please read website Cookie, Privacy, and Disclamers by clicking HERE. To contact me click HERE. For my YouTube page click HERE