How to Use the VMG to Wind tables
How to use this chart
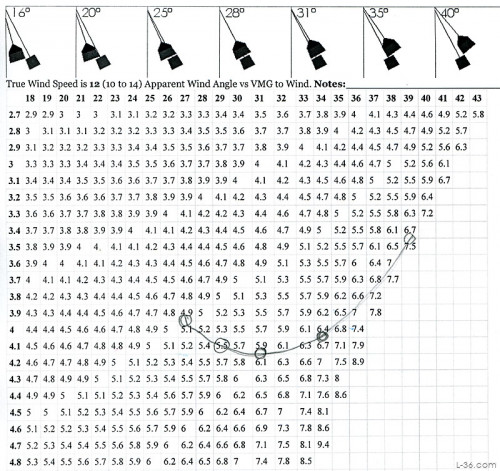
- Pick the chart corresponding to the average true wind speed. The chart above is for 12 knots (11 - 13)
- Sail with your normal settings. Note the speed you are going and hold that speed.
- Note the apparent wind speed by interpolating between the key alignments on the masthead fly shown on the top of the page or using the optional more complete array from step 6 on the main page.
- Plot a point on the table by running down the column for that masthead fly angle until you get to the boat speed and make a mark. Try and plot the average angle that you are observing over some time. For example, for the apparent wind angle of 31 degrees, the boat was going 6 knots for a VMG to Wind of 4.1 to 4.2 knots.
- Pick a boat speed higher and lower by some increment (1/2 knot for example). Hold those boat speeds and note the masthead fly angle. Plot those points. BE sure to give your boat time to get to speed. Mine takes about a minute to get to speed. In this case, since you are holding a speed, it will take time to get to the correct apparent wind angle.
- If you find that you are going faster then the maximum speed in a column just plot it at the maximum listed speed.
- From the data you have plotted, decide if you should plot some other speeds. You would like to have points above the lowest point both to the right and left of that point.
- Draw a smooth line connecting the points
- The lowest point on your smooth curve goes through your target boat speed. This is the speed corresponding to your maximum VMG to Wind
Fast Boats and Missing Points
If you have a very fast boat this chart may not work for you. For example, if you can sail faster than the true wind you probably have more instruments than just a masthead fly so use that. The limitation on this plot is that this is not what they call a single valued function. In English that means that for any apparent wind angle there are two boat speeds that can produce the same VMG to Wind. I am only plotting the first one. As the boat speed gets higher and higher, the VMG actually falls. My suggestion of plotting such points at the maximum is based on the probability that these are off your target apparent wind angle and that the function if fairly flat there anyway meaning the boat speed changes a lot before you actually do decrease the VMG to Wind.You may also find that you are sailing at a speed that is not on the chart for the wind angle you are sailing. For example, you might be going 7.5 knots at 40 degrees apparent but the numbers for the 40 column stop at 7.2. Don't plot that point below the 7.2 number, just plot it at the last number, 7.2 in this case. It would actually be more correct to plot it higher on the column because as discussed above, this is not a single valued function and in this case sailing fast means you are sailing so far off the heading to the mark that your VMG has actually gone down. But as I said above, it is unlikely that these points are near your target boat speed to it just should not matter.
If you find this handy tool not so handy, just use conventional graph paper and plot the VMG from the Calculator for various apparent or true wind angles and find the optimum that way. You can also use the calculator to find the VMG for the missing points and continue to use this paper for most of your points.
NOTICE: Some pages have affiliate links to Amazon. As an Amazon Associate, I earn from qualifying purchases. Please read website Cookie, Privacy, and Disclamers by clicking HERE. To contact me click HERE. For my YouTube page click HERE