Navigation
Weather Report for L‑36.com
By Allen Edwards
Overview
This is not a report on the weather; it is a report on the weather report. Much has changed on the Weather page and I wanted to say a few words, actually likely quite a few words, on the report itself. After all, 90% of you come to L-36.com for our award winning weather coverage*.The biggest change is the fixing of many issues for the half of you who come here from phones or tablets. The page now has no horizontal scroll so it is much easier to navigate. Some of the tables have individual scroll features but scrolling them will not scroll the entire page. This has the hard to describe benefit of page stability. There are several other changes to improve mobile page performance.
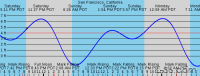
Other note worthy top level changes to the Weather page are the sticky navigation tabs, graphs (with tables optional) for the 3 day wind history on airports and Ports Stations, and a return to location specific radar displays. The NWS discussions have had some formatting improvements. The final top level change I want to draw your attention to is that the tide and current forecast now cover two days which should make it easier to do your planning for tomorrow's trip.
With that out of the way, I want to just highlight some of the possible unknown features in each section. Some of them might be called Easter Eggs.
Header

Marine Forecast
By default, the program will find the closest marine zone to your location along with the synopsis for the greater area. For example, where I sail, PZZ530 is the local are but PZZ500 is the overview of all the 5xx zones. But did you know you can add a third zone? This was added at the request of the US Coast Guard who was instrumental in the initial development of this site. They wanted forecast for where they were and where the boat in distress was. I basically built the Weather page at their request after the retirement by Google of Gadgets. The Coast Guard had used my Gadgets and wanted a replacement. To get the third zone, you click EDIT and enter the zones you want, up to three. I enter 531 and 530 as the first two zones and enter PZZ500 in the text area to get the overview.7-Day Forecast
If you want to check the location being used, there is a link on the lower right next to the forecast that lists the latitude and longitude. Click on that and you will get a map.
Area Discussion
This is weather forecasters talking to weathermen. It can get technical but hovering over the underlined abbreviations will give a pop-up of the definition. You can also click on the title and see the source NWS discussion page without the L-36.com formatting.Weather Reporting Stations
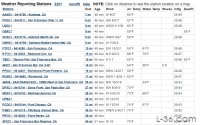
The EDIT link here gives you a distance and the opportunity to include some other reports. The distance is the radius and any station in that radius will be included on your table. You can also select up to three additional stations up to 500 miles away. Finally, you can include ships and drifting buoys by specifying the maximum age of the reports you wish to see. Be aware, that if you specify 5 hours, you may get 5 reports for each ship. For just reports from the last hour, enter 1. Clicking on the title will show the location of the ship for each time displayed.
Below the table is a graph of the closest PORTS station. You can click on the station name and see the station page or you can click on EDIT and select another station. Be aware that if you are not near a PORTS station, this data may not be of interest in which case you can click on (on/off) and it will be gone. If you prefer a table to a graph, click on the (graph/table) option.
Note: The tables in this section are the first of several that you can scroll when using a phone. It does not run off the page, just scroll over to look at the rest of the data. The base page does not scroll so when you are done looking at the table, just scroll down. You do not have to scroll back.
Airport Reports
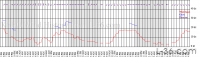
As with the Buoy data, clicking on the airport name will take you to the NOAA page showing data for the last 3 days. I use the actual data that the aircraft would receive and you can see that by clicking on the age readout. This data is very difficult to decode but that is the data that this page decodes so if you want to see it, there it is. Clicking on the wind report data takes you to the NWS page for the airport. This is different than the page you get from clicking on the airport name. That one is a table and this one is more graphical. They are both useful. Clicking on the Temperature data gives yet another page for the airport. This one has a graph and a table of historical observations but they are more frequent than the main page. Next is a quick link to the page that has 5 minute data for the main airport.
Below the main table is a graph or table (options) of the last three days of wind speed, gusts, and direction for the primary airport.
Tides
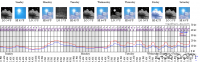
Weather Map
There are two versions of the weather map, Pacific and Atlantic. The one displayed is the black and white version which shows the half of each ocean close to shore. I find this map easier to read than the color one which shows the entire ocean. If you want to see that one, click on the underlined Weather Map at the end of the title line.Satellite Image
Ground Radar
The program picks the closest radar station. If that station is down, which happens occasionally, the next closest is displayed. If you click on the title, you go to the NWS map that stitches all the radars together. You can zoom in there to find your region or look at other regions.In Other News
Finally, there are a couple of hundred articles on this site written by various authors. They are now organized by topic which makes it much easier to find ones you might be interested in. Again, everything has been edited to make it "mobile friendly". I hope you enjoy this site. Please leave a message in the Contact section if you have any questions or suggestions. I thank you for reading this far.Allen
*OK, actually no awards. Just lots of happy users.
Past Home Pages
003 - May 2023002 - May 2023
001 - April 2023
NOTICE: Some pages have affiliate links to Amazon. As an Amazon Associate, I earn from qualifying purchases. Please read website Cookie, Privacy, and Disclamers by clicking HERE. To contact me click HERE. For my YouTube page click HERE