Racing
Analysis of a Tack
Using GPS Tracking Data to Analyze Race Results
By Allen Edwards
Introduction
Regular readers of L-36.com know that I am writing an Android application for racing sailboats. I have had the pleasure this winter of collaborating with a Dutch sailor who is practicing this winter in hopes of winning his class in a major regatta this summer. With their 9th place finish two years ago and their 4th place last summer, we believe it is within reach. StartLine has had many analysis features added to offload some of the required calculations. Also, the unique ability to add routes quickly is an important feature for this particular race where they don't get the course until 10 minutes to the start. It is a real pleasure to get on the water race results as every race helps to improve the application. The last race highlighted the problem of tacking in current and an analysis was done to help in understanding what happened and to insure that the application was giving good advice.
This article is an analysis of a single tack. It uses GPS tracking data to calculate the current and from that to calculate the expected tacking angle. That is compared to the actual tacking angle to see why two additional tacks were required. The boat that is the subject of this analysis is not pictured to the left, but that is a pretty boat isn't it?
Before I start, I want to say a special thank you to my Dutch friend. We met on Google Plus when he expressed interest in StartLine. The changes that he as asked for have greatly improved the program. He is not shy in telling my what should change and his vast sailing experience means that he is virtually always right on. He wanted me to point out that the Dutch are not all skating on ice all winter, although looking at the last Olympics you realize they are pretty good at that.
He races every couple of weeks in weather not near as nice as what I have here in San Francisco bay where my boat sits waiting for Spring. In fairness to myself, winter in San Francisco bay is characterized by many days of no wind followed by a few days of way too much wind. There is an occasional day in winter where the sailing conditions are finer than we ever see even in the summer. Remember what Mark Twain said: "The coldest winter I ever spent was a summer in San Francisco."
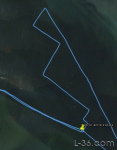
The upwind leg is the leg of interest. We are analyzing the third from the last tack before the mark rounding. We want to know why the boat was not able to make the mark without the last two tacks. The ultimate goal is to come up with better on the water tools for calculating laylines when there is current.
The Data
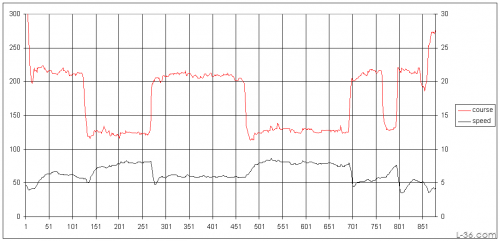
StartLine captures speed and course information. Most GPS analysis programs display that as well although they are calculating it form changes in location. As we are going to filter this data, either approach will work.
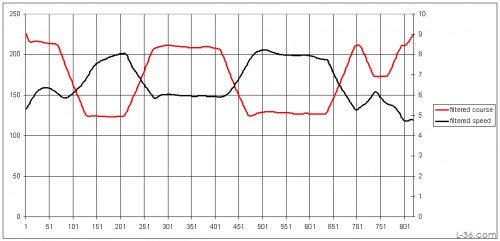
The lower plot is the data with a 60 second averaging. Filtering it makes it easier to pick off a point without as much noise. What we are interested in is getting two points, one before a tack and one after. I am going to take data from tack number 3 and number 4 counting from the first tack which was at about 210 degrees sailed at about 6 knots. I picked those tacks because they represent the tack right before the one we are going to analyze and thus represent data that would have been available to the boat at the time. StartLine will display the actual angle that the boat is tacking through but this can also be read off any GPS by substracting the two headings.
The two points of interest are:
- 8 kt at 125 degrees
- 5.9 kt at 207 degrees
It is obvious from this that the boat is sailing in current as we can assume that the wind was the same on both port and starboard tack and that therefore the difference in ground velocity is from current and that the boat speed over water is the same on both tacks.
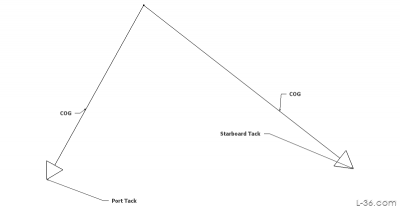
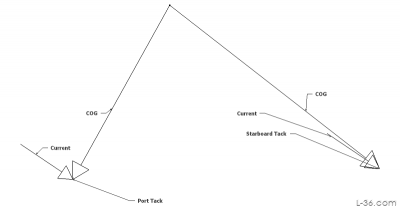
Plotting the Vectors
The first step is to plot the two vectors representing the velocity of the port and starboard tack we read off the GPS data. For that I used a free CAD program that is super simple to use called SketchUp. I drew the vectors pointing straight up with a length equal to the speed, then rotated them the number of degrees required. For the current vectors, I then moved them. Creating a group out of the line and the triangle makes everything easier to move. When a second identical vector required such as the current vector, the program allows for duplication so you don't have to create the same vector twice. You can duplicate while you rotate or move a vector which makes for a very easy to use interface.
On top of that, we add the current vectors, in this case 1.9kt at 124 degrees. This is our starting guess as it was the value entered into StartLine for this leg and at this point is our best number. We will soon know if this was a valid assumption.
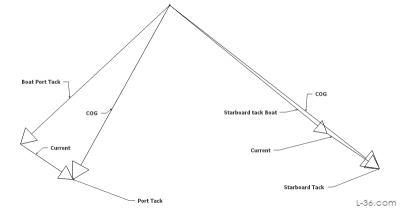
Finally we can plot where the boat over water would have had to be to get pushed by the current and end up where the GPS tracked it. The math for the GPS COG velocity is that it is the sum of the boat through the water and the current. What we are doing in the sketch is calculating the boat over water by subtracting the current from our GPS values.
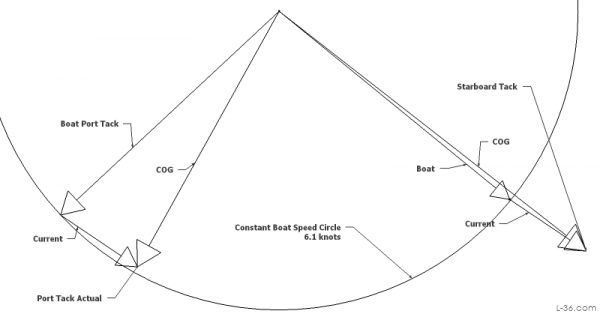
The check on this is to compare the boat speed over water on Starboard tack with the boat speed on Port tack. If our sketch is correct, if the current is correct, then the speeds of the boat on port and on starboard will be the same. If they are not, then we need to adjust our assumption on current until we get a sketch where the boat speeds are the same. If we draw a circle from our origin point with a radius equal to the speed of one boat, it should also pass through the tip of the speed of the boat on the other tack. It does so the assumption on current was a good one.
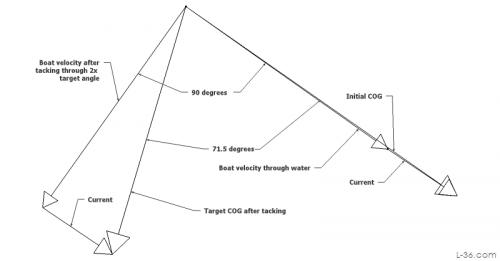
Analysis of Target Tacking Angle
With the current verified, we can now calculate what the tacking angle should be assuming the boat tacks through its target angle. The previous analysis also gives us the boat speed through the water, 6.1kt. From that we can look at the upwind targets and see that the wind would have been 8 knots and our target apparent wind angle is 45 degrees. That means the target tacking angle over water is 90 degrees. Taking the starboard tack as the starting point, we then rotate the boat over water vector 90 degrees, add the current vector, and we have the target port tack COG vector. Measuring the angle between them we get 71.5 degrees, which rounds to the calculation in StartLine of 72 degrees.
Compare with What happened on the water
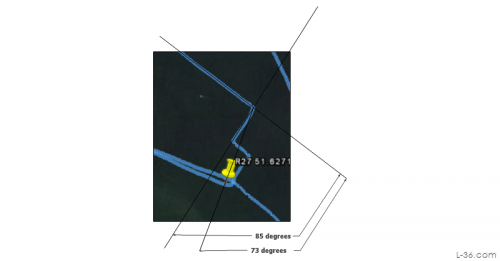
We also know from the vector analysis of the boat and current that this boat was not tacking thought its target angle. There was wind shift and other issues. Using the target tacking angle was probably not the best strategy for calling the layline. Better would have been to observe the pervious tacks either by noting the difference between the GPS headings, or reading out the last tack display on something like StartLine. Then when the GPS indicates a TURN (Garmin term) equal to what the boat has been doing, you are at the layline. We know from the two vectors we from the track analysis that the boat was tacking through 81 degrees. The GPS track at the left shows what happened at this last tack. If they had been tacking through 90 degrees on the water, they would have tacked at just the right point. But this particular tack was not even as tight as the previous one being 85 degrees. Thus two more tacks were required. Better than overshooting the mark, but not what was expected. But we now know why and will do better next time. That is, after all, the reason for doing an analysis like this.
Footnote
One thing that should be pointed out about this particular analysis is that we were lucky that the current was more or less aligned with the boat heading. If the current had been at 45 degrees to the boat heading, we would not have seen any difference in boat speed. In that case, we would have had to assume that the boat was tacking through its target angle to find the current. That would not have worked here but would in most cases so this type of analysis can still be useful. I wanted to point this out in case you want to do this kind of analysis yourself.
NOTICE: Some pages have affiliate links to Amazon. As an Amazon Associate, I earn from qualifying purchases.
Please read website Cookie, Privacy, and Disclamers by clicking
HERE.
To contact me click
HERE. For my YouTube page click
HERE