Welcome to L-36.com
Your source for all things sailing and marine
New Airport Weather Page
I am excited to share a new page dedicated to presenting official forecasts for any major airport. This page decodes and presents the official METAR and TAF data that shows actual and firecast weather data published by the FAA. This data is used by pilots and is important enough that it can be more accurate than the general forecasts. I decode it so it is more meangiful to you. I use local time insteat of UTC and I decode the sky observations to just show what you would see. I don't really care that there are light clouds above the totally overcast sky I see on the ground. I present the appropriate coverage description for the sky you would see from the ground. This is the same decoding I do in the Airport table on the weather and tide page but the presentation is different. I hope you like it. You can enter any airport and a cookie will remember what you are interested in. Please leave a comment if you have suggestions. Airport Weather PageAbout L-36.com

I started L-36.com over 20 years ago as a service to the 71 boats in my class. Papoose is L-36 #5 and was my dad's boat until his death in 1989. I have been sailing longer than I can remember and decided to bring the boat up to San Francisco Bay. Initially I sailed with my young family but as they moved on I did day sailing with friends and ultimately racing. I raced for about 15 years. Initially as a classic wood boat in the Master Mariners Regatta. One of the joys of my life was the first time I won the L-36 class. After my famous dismasting, I soured on the MM and focused on club racing where I dominated for a decade winning most races, sometimes sweeping the series. I would occasionally even finish first uncorrected even though I had the highest handicap. With Covid I retired from racing. I tell people I was tired of winning and afraid of losing which is both a joke and the truth.
L-36.com has grown over the years. It now gets between 100,000 and 200,000 visits a month. The turning point was when the USCG asked me to create the Weather page. It turns out they had been using some "Google Gadgets" I had created. I had some for marine weather and some for tides. When Google stopped supporting the Gadgets, the Coast Guard wanted a replacement. It was an honor to create the page for them and they credited me with "helping to save lives". The page became very popular and is by far the most visited page on this site. The goal was to put the plethora of weather and tide information all on a single page.
My name is Allen Edwards, not to be confused with my late father Allen Edwards or my son Allen Edwards. I grew up in Los Angeles and came to the San Francisco Bay Area to attend Stanford University where I got a Bachelor's and Master's degree in Electrical Engineering. After graduation I worked for Hewlett Packard where I designed electronic test equipment. I was there for 21 years. The most widely known thing I helped invent was at Stanford Telecom where I worked for about ten years. We invented the Cable Modem and I hold one of the early patents. Eventually Intel bought the group I was running as a way to enter the Cable Modem supplier world. By that time I was the Vice President and General Manager of the group and being responsible for a group of people who just got bought by another company is a story itself that will not be told here. I retired from Intel in 2001. Actually, I didn't retire, I quit -- I was too young to retire. From there I did some stock trading, became a bird photographer, started this website, and of course worked on and sailed Papoose.
Now I am old enough to retire. I spend my time working on this site, doing things around the house, and sailing. My crew, a friend from HP days, and I sail every Tuesday most every week. We picked Tuesday because that was race day and we made a point to keep our calendars clear on Tuesdays. I didn't count, but I would say we sailed 40 days last year. We sail unless there is rain, lightning, gale, the forecast says 30 knots, or the boat is broken or in the yard. I love sharing what I have learned over the years. My YouTube channel is @L-36. I have over 100 articles here on L-36.com plus almost 20 on Soft Shackles alone, most of which I invented. If there is something you would like me to write about, please leave a comment HERE.
Featured
Weather and Tide
L-36.com's popular Weather & Tide tool compiles all the information you need to prepare for your next (or current) marine adventure. Check it out if you have not already or enjoy the overviews below.
Seven Great Boating Tools

Over the last four decades as a wooden sailboat owner, I've purchased and tested countless tools for maintaining my boat. Among them, the 7 products listed below stand out as my favorites. I use these regularly and have frequently recommended them to friends over the years. The images included feature the actual tools I own; if you see a hand in a picture, it's mine.
For more articles visit The Articles Tab or select one of the topics below.Unassisted Mast Climbing , Line and Rigging , Boat Maintaince , Electrical and DIY , Navigation, Miscellaneous, Racing, Interesting Wood Boat Repairs, L-36 specific articles
Over 900 FREE Manuals
Another generous donation of 84 manuals from the J/109 Class Association brings the total number to over 900 for the L-36 manual collection. Check them out! Donations like this are very much appreciated and help keep L-36.com going.
As is indicated in the title, the site offers over 900 manuals to help you in keeping your old boat going. Many hare hard to find obsolete equipment. I found most online on various sites and many were donated by generous L-36.com viewers in appreciation for the resource and wanting to do their part to help. I truly appreciate the donations. If you have some manuals you would like me to host, just send a comment. Just remember my name is "Allen".Soft Shackles
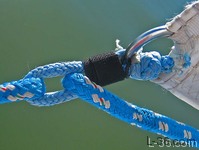
Known by some as "the soft shackle expert," my soft shackle designs have been featured on platforms like Animated Knots and many YouTube channels. In the articles below, I'll guide you from the basics to crafting these shackles.
While I co-invented the stronger version, I personally lean towards the popular "better soft shackle". For added strength, opting for thicker Amsteel does the trick. The articles offer straightforward, step-by-step instructions, addressing any potential challenges.
On my boat, I rely on the better soft shackle for overlapping jib sheets, utilizing line shackles for the main halyard and light air sheets. The y-sheet shackle comes in handy for high-wind spinnaker sheets. Towards the end of the articles, explore additional designs that, though no longer in my personal use, may pique your interest.
NOTICE: Some pages have affiliate links to Amazon. As an Amazon Associate, I earn from qualifying purchases. Please read website Cookie, Privacy, and Disclamers by clicking HERE. To contact me click HERE. For my YouTube page click HERE