Weather
SF Bay Current Forecast Maps
Version 8.1
Overview
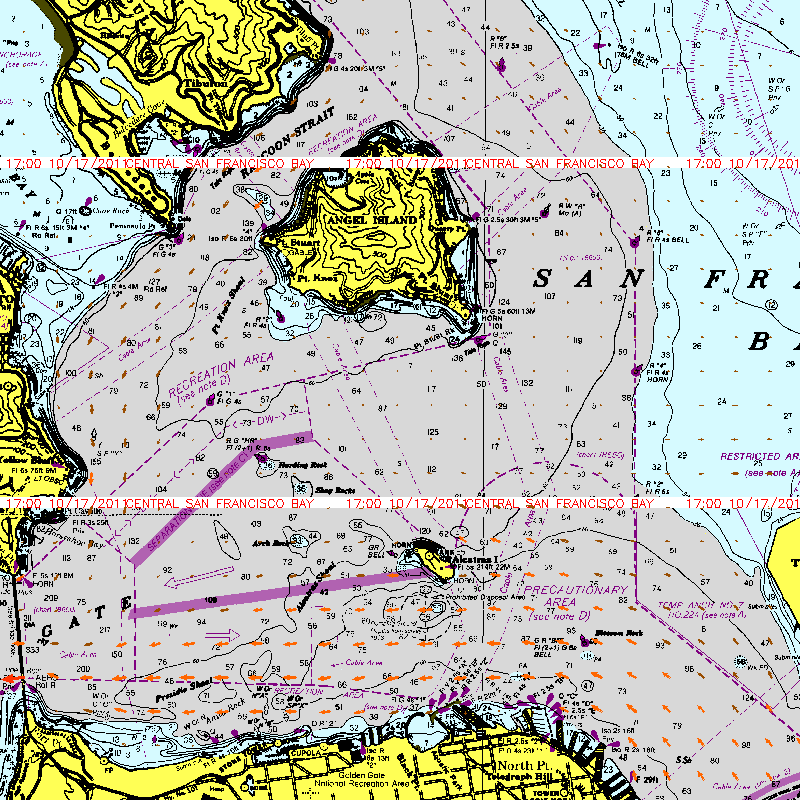
Over the course of many months, maps of small sections of SF Bay that were online showing current predictions for that day and hour were downloaded by this site. They were maps generated by SF Ports to replace the bay model that is up in Sausalito as a prediction tool. That tool was in turn replaced by newer models and is no longer available. The program here that downloaded these small maps stitched them together to form north bay and south bay large maps. This program segments them into the 10 sub areas represented by the possible selections in the program. To date users have requested 45,000 of these sub maps, one of which is what is displayed.The program is looking for which map best matches the current characteristics of the day and time entered into the program. Each of the possibilities is scored and the one with the highest quality metric, based on the programs algorithm, is displayed.
I can't guarantee the accuracy of these results and I just opened up the criteria so days that are not ideal matches will still print maps. The quality number is now displayed. One user requested a time that represented a start time for the Master Mariners Regatta this year (2023). No map was displayed and an error was generated which showed up in the error log. The quality number that was blocked was 24 but the map from 10 minutes earlier had a quality number of 50 and 10 minutes later had 69. Either of those times would have been displayed. All of these three maps look very similar and the important things like where is the current strong, and where is it weak are the same. So be aware of what the program is doing and good luck in your sail, paddle, or swim. Also be aware that things like river flow, which the author of the program said were insignificant but some would disagree are not considered. Also there are differences in dredging and waterline improvements that are also not considered. The maps are from 2011.
See the links below for more details. NOTE: If you want to print, the map will be on page 2.
Enter Area, Date, and Time
These charts are a best effort match to old SFPORTS charts based on similar tidal conditions and are
NOT FOR NAVIGATION
Quality of this match is 70.25
San Francisco Bay Entrance:
1:04AM 2.94 4:45AM Slack 6:39AM -1.44 9:30AM Slack 12:28PM 1.56 2:53PM Slack 6:44PM -4.04 10:43PM Slack
Map is for: CITY -- 11/24/2025 at 14:55Links:
Overview
Example of use
Discussion of Accuracy
NOTICE: Some pages have affiliate links to Amazon. As an Amazon Associate, I earn from qualifying purchases. Please read website Cookie, Privacy, and Disclamers by clicking HERE. To contact me click HERE. For my YouTube page click HERE
